


This post was updated in August 2018 to include new information and examples.
At many points in the semester you will be asked to calculate marginal values. The most common are marginal cost and marginal benefit. The marginal cost formula is: Change in total cost divided by change in quantity or:
Change in TC / Change in Q = MC
While the formula for marginal benefit is the change in total benefit divided by the change in quantity or:
Change in TB / Change in Q = MB
We will now go over several examples of calculating marginal benefit and marginal cost to show how to get this right on exam or homework questions. This example problem goes over the degree of comfort experienced at different levels of clean air. The different dollar value amounts are shown for every 10% increase in clean air. We want to find the optimum amount of clean air that we should have in this area, and it is important to remember that there is an optimal amount of pollution. Having 100% clean air is probably never going to be the solution.
So the first step is to recognize the type of data we are working with. In this problem we have a table of information showing us what the benefits and costs are for different levels of clean air.
As we would expect, the more clean air we have in our economy, the higher the benefit we receive (we prefer clean air over dirty air). However, as we produce (or clean) more of the clean air we also incur a cost. As more clean air is present, the higher our costs. Note that benefits here is the same as utility,
% of Clean Air
|
Total Benefits
|
Total Cost
|
0%
|
0
|
0
|
10%
|
50
|
45
|
20%
|
130
|
50
|
30%
|
205
|
58
|
40%
|
269
|
68
|
50%
|
319
|
81
|
60%
|
351
|
96
|
70%
|
371
|
115
|
80%
|
386
|
150
|
90%
|
398
|
200
|
100%
|
406
|
280
|
The next step is to calculate the marginal benefits (marginal utility), and marginal costs. In order to do this we should begin at 0% clean air. When we move to 10% clean air, we see that benefits go up by 50, and costs go up by 45. This means that our marginal benefit from 10% clean air is 50, and our marginal cost of 10% clean air is 45. We know these are our marginal values by using the marginal benefit and marginal cost formulas described at the beginning of this post. For example, marginal benefit is equal to the ending benefit and 50 minus the starting benefit of 0. The difference is then divided by the change in Q or 10% increase in clean air (from 0% to 10%).
When we move from 10% to 20% we see total benefit change from 50 to 130. This means that marginal benefit from another 10% increase in clean air (from 10% to 20%) is 80 (130-50). The increase in cost is 5 (50-45) which is also our marginal cost. We can repeat these calculations all the way to a clean air amount of 100% and we will end up with the following table:
When we move from 10% to 20% we see total benefit change from 50 to 130. This means that marginal benefit from another 10% increase in clean air (from 10% to 20%) is 80 (130-50). The increase in cost is 5 (50-45) which is also our marginal cost. We can repeat these calculations all the way to a clean air amount of 100% and we will end up with the following table:
% of Clean Air
|
Total Benefits
|
Total Cost
|
Marginal Benefits
|
Marginal Cost
|
0%
|
0
|
0
| ||
10%
|
50
|
45
|
50
|
45
|
20%
|
130
|
50
|
80
|
5
|
30%
|
205
|
58
|
75
|
8
|
40%
|
269
|
68
|
64
|
10
|
50%
|
319
|
81
|
50
|
13
|
60%
|
351
|
96
|
32
|
15
|
70%
|
371
|
115
|
20
|
19
|
80%
|
386
|
150
|
15
|
35
|
90%
|
398
|
200
|
12
|
50
|
100%
|
406
|
280
|
8
|
80
|
The table above shows us that marginal costs increase as more clean air is produced, and that marginal benefits decrease as more clean air is produced. This relationship holds even though total benefits and total costs BOTH increase as the percent of clean air increases.
This result is consistent with the theory of diminishing marginal utility (for marginal benefits), and diminishing marginal returns (for increasing marginal costs).
This result is consistent with the theory of diminishing marginal utility (for marginal benefits), and diminishing marginal returns (for increasing marginal costs).
If we graph the marginal costs and marginal benefits, we will get our typical looking supply and demand graph where marginal costs represent supply (supply of clean air) and marginal benefits represent demand (demand for clean air).
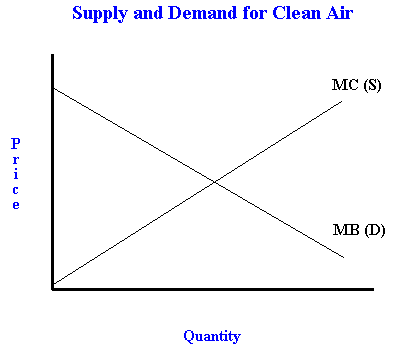 |
| Sample graph showing interaction of marginal benefit and marginal cost |
There are two ways to find the optimum amount of clean air. The most basic economic way is to figure out where marginal benefits equal marginal costs. In our table above, they are never perfectly equal, but at 70% clean air, we see that marginal benefit is 20, and marginal cost is 19. This is pretty close (the closest we can get with the information that is given), and since MB are greater than MC then this is a valid solution. The true answer will probably be closer to 71% but 70% is pretty close--and would be the most correct answer with the information that is provided.
Another way to do it is to find the difference between total benefits and total costs and choose the biggest number. The difference between total benefits and total costs is called net benefits. The net benefit formula can be written as:
Net Benefits = Total Benefits - Total Costs
Theoretically either method will give us the same result so let’s test it:
Net Benefits = Total Benefits - Total Costs
Theoretically either method will give us the same result so let’s test it:
% of Clean Air
|
Total Benefits
|
Total Cost
|
Net Benefit
|
0%
|
0
|
0
|
0
|
10%
|
50
|
45
|
5
|
20%
|
130
|
50
|
80
|
30%
|
205
|
58
|
147
|
40%
|
269
|
68
|
201
|
50%
|
319
|
81
|
238
|
60%
|
351
|
96
|
255
|
70%
|
371
|
115
|
256
|
80%
|
386
|
150
|
236
|
90%
|
398
|
200
|
198
|
100%
|
406
|
280
|
126
|
As you can see, our 70% clean air level gives us the highest net benefit. Although it is only 1 higher than the 60% clean air level, it is higher. This result is consistent with our MB = MC analysis so we should be confident that 70% clean air is the correct amount for this economy.
If you want help developing your intuition about calculating marginal benefits and marginal costs and how they interact to attain equilibrium I would recommend watching the examples in the video below:
If you want help developing your intuition about calculating marginal benefits and marginal costs and how they interact to attain equilibrium I would recommend watching the examples in the video below:


