


This economics post is going to go over the economic concept of a reduction in demand. It includes some examples and graphs to help with the concept, let me know if there are any questions or additions in the comments below:

If we start out with the typical supply and demand graph, we
know that equilibrium is going to be where the supply and demand curves
cross. We can see this point on the
graph to the right. When you draw a line
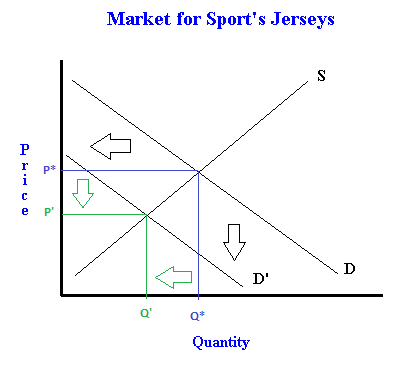
straight down from the intersection point you can find equilibrium
quantity. In the graph equilibrium quantity is marked with Q*. When you draw a line to the
left you can find equilibrium price. In the graph equilibrium price is marked with P*. Q* and P* will continue to be equilibrium quantity and equilibrium price until something changes in the scenario (such as change in a determinant of demand).
A crucial part in figuring out why a demand curve shifts,
and how to find out the resulting equilibrium price and quantity is to focus on WHY it shifts. There are several determinants of demand that could decrease demand and shift the curve left. (Depending on the textbook you reference) These determinants of demand that could reduce demand include: less consumers, lower income, a negative change in tastes, or a price of a substitute good went down.
Once you understand the cause of the shift AND the direction of the shift, we need to know what happens in the market. This means it is important to determine if equilibrium price and quantity have gone up or down (or possibly stay the same). I made a supply and demand cheat sheet documenting all of the possible combinations of shifts the resulting equilibrium price and quantities in another post.
Once you understand the cause of the shift AND the direction of the shift, we need to know what happens in the market. This means it is important to determine if equilibrium price and quantity have gone up or down (or possibly stay the same). I made a supply and demand cheat sheet documenting all of the possible combinations of shifts the resulting equilibrium price and quantities in another post.
Let's consider an example:
Suppose the number of buyers in a market declines (for example, lots of people move away from New York and therefore less people will be Yankees Jerseys).
When we shift the demand curve to the left, we see that we now have a new equilibrium point. This point is lower, and to the left of the original equilibrium level. When we draw the lines to the price and quantity axis, we can see that both equilibrium price and equilibrium quantity have gone down.
Consider another example:
Imagine the market the
athletic jersey of a famous football star before and after he changes
teams. Before he changes teams the
market for his jersey is in equilibrium with a set number of people willing and
able to buy it at some price. However,
after he changes teams, most people will not want to purchase the old jersey
because it is no longer up to date, the resulting sales of the jersey decline
(equilibrium quantity down) and the jerseys are usually placed on sale
(equilibrium price down). This would be an example of tastes and preferences changing.
A third example:
Suppose an online retailer offers the jersey for a much lower price. This is an example of a substitute good and since the price of the substitute good declines we would know that the demand for our original good will also decline which results in the demand curve shifting left and equilibrium price and quantity falling.

