


This post is a question an answer for the economics of a perfectly competitive firm.
Suppose the following data summarize the cost of a perfectly
competitive firm:
a) draw the firm's MC curve on a graph
b) draw the market supply curve on another graph
c) what is the equilibrium price in this market?
a) draw the firm's MC curve on a graph
b) draw the market supply curve on another graph
c) what is the equilibrium price in this market?
Perfectly Competitive Firm
|
||||
Quantity
|
Total Cost
|
Marginal Cost
|
Fixed Cost
|
Variable Cost
|
0
|
100
|
|||
1
|
101
|
|||
2
|
103
|
|||
3
|
106
|
|||
4
|
110
|
|||
5
|
115
|
|||
6
|
121
|
|||
7
|
128
|
|||
8
|
136
|
|||
So we are given the information in the table above, and this
is the only information needed to answer each of the questions. We can figure out what the marginal cost of
each unit is by using the following equation:
Marginal cost = Change in total cost / change in quantity
For the above example, change in quantity is always one, so
we can find the marginal cost by only looking at the change in total cost. The marginal cost of the first unit, is 1
(101-100). The marginal cost of the second
unit is 2 (103-101). The marginal cost
of the third unit is 3 (106-103), and so on until we have calculated all of the
marginal costs.
The fixed cost is always going to be equal to 100, and we
know that it is 100 because the total cost is 100 even when we are not
producing anything (remember that fixed costs are costs occurred regardless of
the amount being produced, even if that quantity is zero).
Finally, variable cost can be calculated by subtracting
fixed cost from total cost, and the completed table looks like:
Perfectly Competitive Firm
|
||||
Quantity
|
Total Cost
|
Marginal Cost
|
Fixed Cost
|
Variable Cost
|
0
|
100
|
100
|
0
|
|
1
|
101
|
1
|
100
|
1
|
2
|
103
|
2
|
100
|
3
|
3
|
106
|
3
|
100
|
6
|
4
|
110
|
4
|
100
|
10
|
5
|
115
|
5
|
100
|
15
|
6
|
121
|
6
|
100
|
21
|
7
|
128
|
7
|
100
|
28
|
8
|
136
|
8
|
100
|
36
|
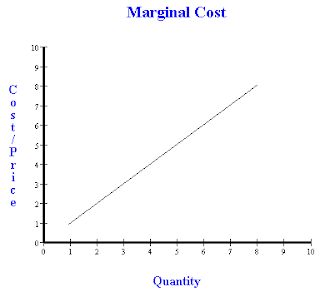
Drawing the marginal cost curve requires us to match up the
numbers in the marginal cost column with those in the quantity column. Because of the nature of this particular firm’s
MC, we get a 45 degree line starting at a quantity of 1.

The market supply curve is the horizontal sum of each
individual firm’s supply curve. So the
market’s supply curve will still begin at a price of 1 (because of the marginal
cost of 1) and end at a price of 8, but now the total quantity supplied will be
multiplied by the number of firms in the market. For example, if there are 10 firms, the
quantity supplied at a price of 5 will be 50 (10*5), but if there are 15 firms,
the quantity supplied would be 75 (15*5).
For the graph below, I have assumed that there are 100 firms in the
market.


Finally, what is the equilibrium price in this market? Normally we try to intersect supply and
demand, but we can also back out the long run equilibrium price by figuring out
where marginal cost and average total cost intersect. This will be our long run equilibrium,
because at this point there is no economic profit by the perfectly competitive
firms. Looking back at our table above,
we can add in other column for average total cost, which we can figure out by
dividing total cost by quantity.
Perfectly Competitive Firm
|
||||
Quantity
|
Total Cost
|
Marginal Cost
|
Average Total Cost
|
|
0
|
100
|
|||
1
|
101
|
1
|
101
|
|
2
|
103
|
2
|
51.5
|
|
3
|
106
|
3
|
35.3
|
|
4
|
110
|
4
|
27.5
|
|
5
|
115
|
5
|
23
|
|
6
|
121
|
6
|
20.2
|
|
7
|
128
|
7
|
18.3
|
|
8
|
136
|
8
|
17
|
|
So obviously this method didn’t work, there must be more
information available that I am missing, feel free to comment in this additional
information and I will finish the problem!


